using JuMP
using HiGHS

# Model
arena_model = Model(HiGHS.Optimizer)

# Sets
row_set = 1:10
col_set = 1:10

# Group data
groups = [
    "a",
    "b",
    "c",
    "d",
    "e",
    "f",
    "g"]
req_seats = Dict(
    "a" => 1,
    "b" => 2,
    "c" => 2,
    "d" => 4,
    "e" => 4,
    "f" => 6,
    "g" => 6)
scores = Dict(
    "a" => 1,
    "b" => 2,
    "c" => 4,
    "d" => 4,
    "e" => 5,
    "f" => 6,
    "g" => 12)
availability = Dict(
    "a" => 3,
    "b" => 2,
    "c" => 3,
    "d" => 5,
    "e" => 2,
    "f" => 1,
    "g" => 1)

# Blocked seats (coordinates [row, column])
blocked_seats = [
    (1, 1),(1, 2),(1,9),(1,10),
    (2, 1),(2, 10),
    (6, 5),(6,6),
    (7, 5),(7,6),
]

# Variables
@variable(arena_model, x[groups, row_set, col_set], Bin)

# YOUR CODE BELOW

# Suggested structure:
# 1. Create parameters
# 2. Set objective function
# 3. Add constraints
# 4. Solve the modelTutorial XI - Arena Seat Planning under Distancing Rules
Applied Optimization with Julia
Introduction
Imagine you’re tasked with optimizing seating arrangements for a major event venue during a pandemic. You need to balance safety with efficiency, ensuring groups can enjoy the event while maintaining proper distancing.
Your challenge is to:
- Place different-sized groups strategically
- Maintain safe distances between all attendees
- Maximize either revenue or total attendance
- Work around venue constraints and blocked seats
The Venue Layout
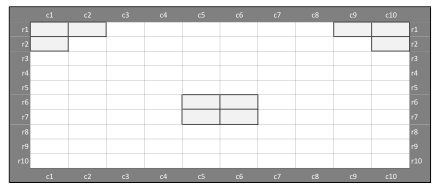
Here is the venue’s seating arrangement - the same one we used in the lecture:
Group Types and Their Characteristics
We have different types of groups wanting to attend the event:
- Singles (Type ‘a’): Solo attendees
- Couples (Types ‘b’ and ‘c’): Two people traveling together
- Small families (Types ‘d’ and ‘e’): Groups of four
- Large families (Types ‘f’ and ‘g’): Groups of six
Each group type has:
- A different ticket value (score)
- Limited availability (how many such groups want tickets)
- Space requirements (how many consecutive seats they need)
As we approach the end of the course, we’ll remove some previous “guardrails” to give you more freedom in solving the problem.
Don’t worry if you cannot solve everything by yourself. Try your best and ask for help if you need it!
1. Implement the Model
First, define all necessary sets, parameters, and variables to model the problem in Julia. The seating area layout is shown below:
Seating Constraints
The following constraints must be maintained:
- Minimum one empty seat between groups
- One empty seat between rows
- One empty seat diagonally
- Maximum two groups per row
- Grey seats are obstacles and cannot be used
ImportantCommon Pitfalls
Watch out for the edge cases when implementing distancing constraints - especially around blocked seats! Also make sure that a group cannot start so far to the right that it would stick out beyond the last column - fix these variables to zero.
Define the Model
The groups are given differently than in the lecture! Either adjust the data or the model, depending on what you think is easier.
Visualization
To test your solution, visualize it with a plot in Julia. The visualization is a great tool to check if your solution is correct. Your first model will likely run without errors and yet still violate some seating rule - the plot makes such violations easy to spot, as they are marked with a red cross. If everything works from the start, great!
using Plots

# Create visualization of the solution
function visualize_seating(model)
    # Determine which group covers each seat
    seat_owner = fill("", length(row_set), length(col_set))
    violations = Tuple{Int,Int}[]
    for g in groups, r in row_set, c in col_set
        if value(model[:x][g,r,c]) > 0.5  # Using 0.5 to handle floating point
            for cc in c:(c+req_seats[g]-1)
                if cc > maximum(col_set)
                    # Group sticks out beyond the last column
                    push!(violations, (r, maximum(col_set)))
                    break
                elseif (r,cc) in blocked_seats || seat_owner[r,cc] != ""
                    # Group covers a blocked seat or overlaps another group
                    push!(violations, (r, cc))
                else
                    seat_owner[r,cc] = g
                end
            end
        end
    end

    # Create color mapping for groups
    color_map = Dict(
        "a" => :blue,
        "b" => :green,
        "c" => :red,
        "d" => :purple,
        "e" => :orange,
        "f" => :yellow,
        "g" => :pink
    )

    # Create plot
    plt = plot(
        aspect_ratio=:equal,
        xlims=(0.5,10.5),
        ylims=(0.5,10.5),
        yflip=true,  # Flip y-axis to match traditional seating layout
        legend=:outerright
    )

    # Plot empty and blocked seats
    for r in row_set, c in col_set
        if seat_owner[r,c] == ""
            is_blocked = (r,c) in blocked_seats
            scatter!(plt, [c], [r],
                    color=is_blocked ? :gray : :white,
                    markersize=10,
                    markershape=:square,
                    label=nothing)
        end
    end

    # Plot occupied seats with one legend entry per group type
    shown_groups = String[]
    for r in row_set, c in col_set
        g = seat_owner[r,c]
        if g != ""
            scatter!(plt, [c], [r],
                    color=color_map[g],
                    markersize=10,
                    markershape=:square,
                    label=g in shown_groups ? nothing : g)
            push!(shown_groups, g)
        end
    end

    # Mark constraint violations in a loud color instead of hiding them
    for (r,c) in violations
        scatter!(plt, [c], [r],
                color=:red,
                markersize=8,
                markershape=:x,
                label=nothing)
    end

    title!(plt, "Arena Seating Layout")
    xlabel!(plt, "Column")
    ylabel!(plt, "Row")

    return plt
end

# Display the visualization
plt = visualize_seating(arena_model)
display(plt)
If you encounter any difficulties and cannot solve the problem, please document your issues here:
#=


=#
2. Maximize the number of seats in use
Now let’s explore a different optimization objective! Instead of focusing on revenue, imagine you’re trying to accommodate as many people as possible at your venue - perhaps for a community event where maximizing attendance is more important than maximizing profit.
Think about how this changes your objective function. What matters now is not the score per group, but how many seats each group occupies!
Which group types do you expect to gain or lose seats under the new objective? Compare the values per seat of the different group types before you solve the model!
Store the number of occupied seats from the first task in a variable before you change the objective. Once you re-optimize arena_model, the first solution is gone!
Try implementing this new objective while keeping all the safety constraints in place.
# YOUR CODE BELOWCheck if your solution is correct by visualizing it with the visualize_seating function below.
# YOUR CODE BELOWHow many more seats are in use when compared to the previous solution? Write a short code that calculates and prints the difference.
# YOUR CODE BELOWSolutions
You will likely find solutions to most exercises online. However, I strongly encourage you to work on these exercises independently without searching explicitly for the exact answers to the exercises. Understanding someone else’s solution is very different from developing your own. Use the lecture notes and try to solve the exercises on your own. This approach will significantly enhance your learning and problem-solving skills.
Remember, the goal is not just to complete the exercises, but to understand the concepts and improve your programming abilities. If you encounter difficulties, review the lecture materials, experiment with different approaches, and don’t hesitate to ask for clarification during class discussions.