Session 03-02 - Linear Functions & Economic Applications
Section 03: Functions as Business Models
Entry Quiz
Review from Session 03-01
Work individually
Given \(f(x) = 2x - 8\), find:
- \(f(5)\)
- The value of \(x\) when \(f(x) = 10\)
A company has cost function \(C(x) = 1000 + 25x\) and revenue function \(R(x) = 40x\). Find the break-even point.
Does the equation \(x = y^2 - 4\) represent \(y\) as a function of \(x\)? Explain using the vertical line test.
Homework Discussion
Sharing Solutions from Tasks 03-01
What are your main questions?
- Any questions regarding functions?
- Have you understood how to plot functions?
- How did you handle two variables in the tutorial?
Learning from Others
Remember - there’s often more than one way to solve a problem!
Learning Objectives
Learning Objectives
By the end of this session, you can:
- Convert between slope-intercept and point-slope form
- Model costs, demand, supply, and depreciation with linear functions
- Find the market equilibrium and interpret it economically
- Apply CVP analysis: contribution margin and break-even point
- Build a linear model from observed data points
- Justify pricing decisions under practical constraints
Linear Forms
Slope-Intercept Form
The most common form: y = mx + b
- m: slope (rate of change/ marginal change)
- Positive: increasing function
- Negative: decreasing function
- Zero: horizontal line
- b: y-intercept (starting value/ base value)
- Value when \(x = 0\)
- Often represents fixed costs or initial values
Visual: Anatomy of a Cost Function
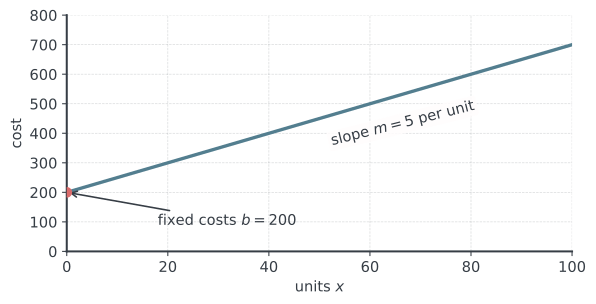
Every linear cost function is just \(y = mx + b\) wearing business clothes: \(b\) is what you pay before producing anything, \(m\) is what each unit adds.
Point-Slope Form
Useful when you know a point and the slope
\[y - y_1 = m(x - x_1)\]
- \((x_1, y_1)\): known point on the line
- \(m\): slope of the line
- When to use:
- Given one data point and rate of change
- Finding equation from two points: slope first, \(m = \frac{y_2 - y_1}{x_2 - x_1}\)
- Modeling from observed data
Example: Price Change
We have already done this by intuition, now let’s formalize it
A product costs 50 EUR when producing 100 units. Each additional unit reduces the price by 0.20 EUR.
\[p - 50 = -0.20(x - 100)\] \[p = -0.20x + 20 + 50\] \[p = -0.20x + 70\]
Parallel and Perpendicular Lines
Critical for understanding related economic functions
- Parallel lines: Same slope (\(m_1 = m_2\))
- Example: Two companies with same variable cost per unit
- Different fixed costs create parallel cost functions
- Perpendicular lines: \(m_1 \cdot m_2 = -1\)
- Less common in economics
- Sometimes seen in utility theory
Visual: Perpendicular Lines
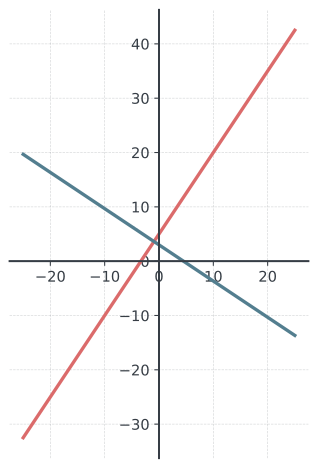
Perpendicular Lines: \(m_1 \cdot m_2 = -1\)
Example: Competing Firms
- Company A: \(C_A(x) = 3x + 1000\)
- Company B: \(C_B(x) = 3x + 1500\)
Question: What do you see here?
- Same variable cost (3 EUR/unit), different fixed costs
- Parallel cost functions!
Visual: Competing Firms
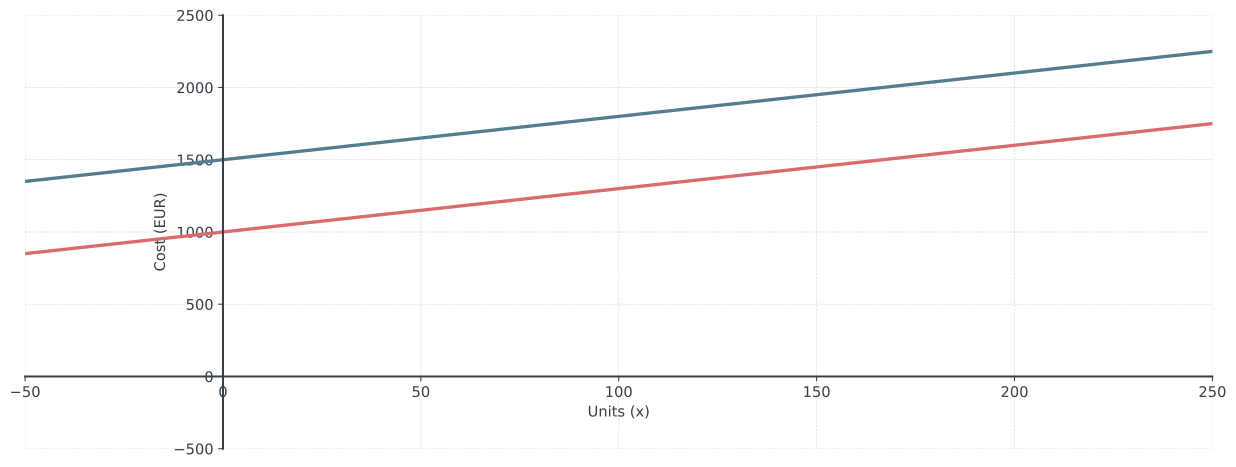
Parallel Lines: Same Slope (\(m = 3\))
Quick Practice
1. Given: \(f(x) = -2x + 7\)
- What is the slope?
- What is the y-intercept?
- Is the function increasing or decreasing?
2. A profit function passes through (50, 2000) with a slope of 30.
- Write the profit function in point-slope form
- Convert to slope-intercept form
- What does the slope represent in this business context?
Supply & Demand
Understanding Demand
Demand shows how quantity purchased depends on price
- Generally decreasing: Higher price → Lower quantity
- Linear demand: \(Q_d = a - bp\) where \(p\) is price
- \(a\): market saturation (maximum quantity, reached when price = 0)
- \(b\): sensitivity to price changes
- Alternative form: \(p = c - dQ_d\)
- \(c\): maximum price (price at which \(Q_d = 0\))
Example: Coffee Shop Demand
Daily coffee demand: \(Q_d = 500 - 50p\)
- At 0 EUR: Would “sell” 500 cups (market saturation)
- At 10 EUR: Would sell 0 cups (maximum price)
- At 4 EUR: \(Q_d = 500 - 50(4) = 300\) cups
Question: Who can draw this?
Visual: The Demand Curve
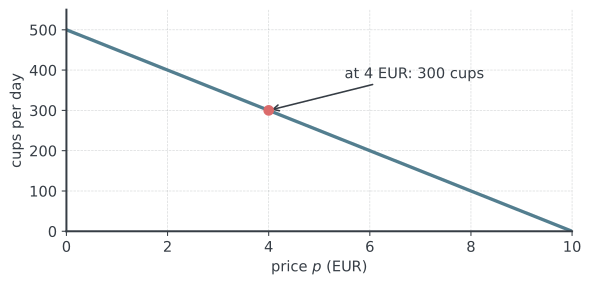
Downward-sloping: every 1 EUR price increase costs 50 cups of demand.
Understanding Supply
Supply shows how quantity produced depends on price
- Generally increasing: Higher price → Higher quantity
- Linear supply: \(Q_s = -c + dp\) where \(p\) is price
- A negative quantity is outside the economic domain
- For \(c > 0\), supply becomes positive only above \(p = c/d\)
- \(d\): production response to price
Example: Coffee Shop Supply
Daily coffee supply: \(Q_s = -100 + 100p\)
- Below 1 EUR: No supply (not profitable)
- At 3 EUR: \(Q_s = -100 + 100(3) = 200\) cups
- At 5 EUR: \(Q_s = -100 + 100(5) = 400\) cups
Question: Anyone who can draw this?
Market Equilibrium
Equilibrium occurs where supply equals demand
\[Q_d = Q_s\]
- Equilibrium price (\(p^*\)): Market-clearing price
- Equilibrium quantity (\(Q^*\)): Amount actually traded
- Graphically: Intersection of supply and demand curves
- Economically: No shortage or surplus
Finding Equilibrium Example
Using our coffee shop:
- Demand: \(Q_d = 500 - 50p\)
- Supply: \(Q_s = -100 + 100p\)
At 4 EUR per cup, suppliers want to sell exactly 300 cups, and consumers want to buy exactly 300 cups. The market clears!
Question: How would this look like if we graph it?
Visual: Market Equilibrium
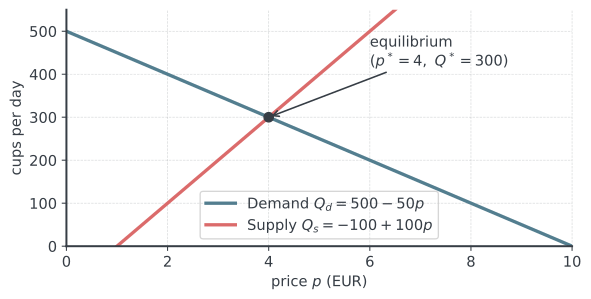
Left of \(p^*\) demand exceeds supply (shortage), right of it supply exceeds demand (surplus) - the market pushes the price back to the intersection.
Break
Guided Practice
Individual Exercise Block I
Work alone for 10 minutes, then discuss
Convert between forms:
- Given two points (2, 10) and (5, 19), find the slope-intercept form
- Rewrite \(2x - 3y = 12\) in slope-intercept form
A local bakery faces:
- Demand: \(Q_d = 200 - 10p\) (loaves per day)
- Supply: \(Q_s = 50 + 15p\) (loaves per day)
Find the equilibrium price and quantity.
Individual Exercise Block II
Work alone for 5 minutes, then discuss
Two taxi companies have cost functions:
- Company A: \(C_A(x) = 5 + 2x\) (x in km)
- Company B: \(C_B(x) = 2 + 2.5x\)
- Which company is cheaper for a 5km ride? A 10km ride?
- At what distance do they cost the same?
- What do the parameters represent economically?
Exercise Block III - FSP Style
Determine the function from two observations
A printing company charges 410 EUR for 200 flyers and 650 EUR for 400 flyers. The price follows a linear function \(P(x)\).
Determine \(P(x)\)
Interpret the slope and the y-intercept economically
What would 1,000 flyers cost?
Cost-Volume-Profit
The CVP Framework
The relationship between costs, volume, and profit
- Fixed Costs (FC): Independent of production volume
- Variable Costs (VC): Change with production volume
- Total Costs: \(TC = FC + VC \times Q\)
- Revenue: \(R = P \times Q\) (Price × Quantity)
- Profit: \(\Pi = R - TC = PQ - (FC + VC \times Q)\)
- Contribution Margin: \(CM = P - VC\)
Puzzled why we use a different notation now? In mathematics, you can assign any variable to any quantity, as long as you are consistent.
CVP Example: Restaurant
A restaurant has:
- Fixed costs: 8,000 EUR/month (rent, salaries)
- Variable cost per meal: 12 EUR (ingredients, utilities)
- Selling price per meal: 25 EUR
How many meals cover the monthly costs?
Restaurant: Covering Fixed Costs
Each meal contributes 25 - 12 = 13 EUR toward fixed costs and profit.
- Break-even: \(Q_{BE} = \frac{8000}{13} \approx 615.38\) meals; at least 616 whole meals to avoid a loss
- At 1,000 meals: \(\Pi = 1000(13) - 8000 = 5000\) EUR
- Sales can fall by 384 whole meals: \(\Pi(616) = 8\) EUR, but \(\Pi(615) = -5\) EUR
Modeling from Data
Creating Linear Models
From real-world observations to mathematical functions
Steps to create a linear model:
- Identify the variables (dependent vs. independent)
- Plot the data points (if possible)
- Calculate the slope between points
- Use point-slope form to find equation
- Interpret parameters in context
Example: Sales Forecasting
Monthly sales data:
| Month | Units Sold |
|---|---|
| 1 | 120 |
| 2 | 135 |
| 3 | 150 |
| 4 | 165 |
- Is there a linear trend? +15 units per month
- Using month 1: \(S - 120 = 15(m - 1)\), so \(S(m) = 15m + 105\)
Spot the Error
A student modeled two situations. Find and fix the mistakes!
1. “A gym charges a 30 EUR sign-up fee plus 20 EUR per month.”
\[C(t) = 30t + 20\]
2. “At price 0 EUR customers would buy 40 units, and demand falls by 5 units per euro of price.”
\[Q_d = 40 + 5p\]
Depreciation Models
Linear Depreciation
Straight-line depreciation: Constant value loss over time
\[V(t) = V_0 - dt\]
Where:
- \(V(t)\): Value at time \(t\)
- \(V_0\): Initial value
- \(d\): Depreciation rate per period
- If the final value is zero, useful life: \(n = \frac{V_0}{d}\) periods
Example: Company Vehicle
A company buys a new vehicle
- Purchase price: 30,000 EUR
- Depreciation: 5,000 EUR per year
- \(V(t) = 30000 - 5000t\)
- After 4 years: \(V(4) = 30000 - 20000 = 10,000\)
- Fully depreciated after 6 years
Important in financial planning and asset management!
Depreciation Visualization
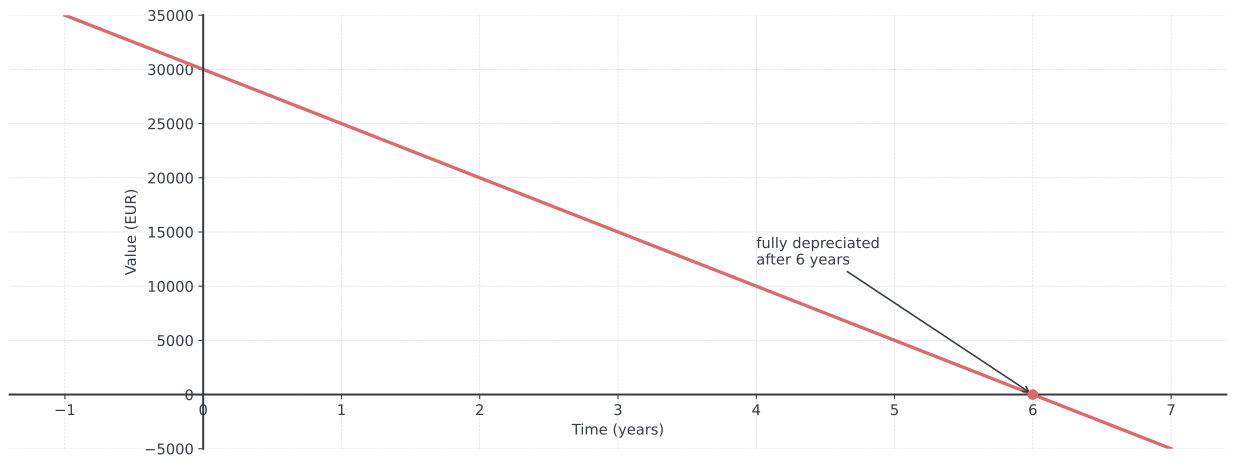
Linear Depreciation: \(V(t) = 30000 - 5000t\)
Team Problem-Solving
Market Analysis Scenario
The Scenario: Local Organic Farm Market
A new organic farm is entering the local market. Research shows:
- Current market demand: \(Q_d = 1000 - 40p\) (kg per week)
- Current market supply (other farms): \(Q_s = 200 + 20p\) (kg per week)
- The new farm can supply: \(Q_{new} = 50 + 10p\) (kg per week)
- The new farm has fixed costs of 500 EUR/week and variable costs of 8 EUR/kg
Your Tasks:
Work in groups of 3-4 students
Find the current market equilibrium (before the new farm)
Find the new equilibrium after the farm enters (supply: \(Q_s + Q_{new}\))
Determine if the new farm will be profitable at the new equilibrium price
Your Tasks II:
Holding the new farm’s quantity from Task 2 fixed, what minimum price would cover its costs? This is a cost calculation, not a new market equilibrium.
If the farms could convince consumers that their organic produce is superior, shifting demand to \(Q_d = 1200 - 40p\), how would this affect their profitability?
Coffee Break
FSP Workshop
Problem 1: Ergonomic Footrests
A manufacturer produces footrests for office workers. Its monthly total costs are linear: 140 footrests cost 10,947 EUR and 380 cost 18,003 EUR. It sells each footrest for 64.90 EUR and can produce at most 548 per month. Every footrest produced is sold. Only whole footrests are possible.
- Determine the cost function \(C(x)\) in EUR for \(x\) footrests per month. Interpret both parameters with units and verify your function using both observations. [5 pts.]
Footrests: Profit and Capacity
Give the revenue and profit functions. Determine the break-even quantity and the smallest whole number of footrests that avoids a loss. Check that number and the preceding one. [4 pts.]
The monthly profit target is at least 9,600 EUR. Determine all feasible whole-item quantities that meet the target at the original price. A salesperson then suggests a 10 % price cut, claiming that extra sales can preserve the target. Costs and capacity stay unchanged. Assess this claim computationally. [5 pts.]
(for verification: \(C(x) = 29.40x + 6831\); the original contribution margin is 35.50 EUR per footrest.)
Footrests: Lowest Viable Price
- The manufacturer expects to sell its full capacity of 548 footrests. Determine the lowest price per footrest, in whole cents, that achieves the monthly profit target of 9,600 EUR. Verify your answer and show that charging one cent less fails. [4 pts.]
Wrap-Up & Takeaways
The Slopes You Met Today
One idea, many business faces
| Model | Function | The slope means… |
|---|---|---|
| Cost | \(C(x) = FC + vc \cdot x\) | variable cost per unit |
| Demand | \(Q_d = a - bp\) | sales lost per EUR price rise |
| Supply | \(Q_s = -c + dp\) | extra supply per EUR price rise |
| Depreciation | \(V(t) = V_0 - dt\) | value lost per year |
| Sales trend | \(S(m) = 15m + 105\) | growth per month |
On the FSP, interpret the slope in context and with units: “the slope is 30” earns no points!
Key Takeaways
- Linear functions model constant rates of change
- Supply and demand intersect at market equilibrium
- CVP analysis reveals break-even points
- Contribution margin shows unit profitability
- Real data can be modeled with linear approximations
Final Assessment
5 minutes - Individual work
Weekly figures for a market’s sole smartphone supplier:
- Demand function: \(Q_d = 800 - 2p\)
- Supply function: \(Q_s = 100 + 3p\)
- Fixed costs: 50,000 EUR
- Variable costs: 80 EUR per unit
- Find the market equilibrium price and quantity
- Calculate the manufacturer’s profit at equilibrium
- What is the contribution margin per unit?
Next Session Preview
Session 03-03: Quadratic Functions & Basic Optimization
- Parabolas and their properties
- Finding vertex using \(x = -\frac{b}{2a}\)
- Maximum and minimum values
- Revenue optimization with price-dependent demand
- Projectile motion applications
Homework Assignment: Complete Tasks 03-02!
Session 03-02 - Linear Functions & Economic Applications | Dr. Nikolai Heinrichs & Dr. Tobias Vlćek | Home